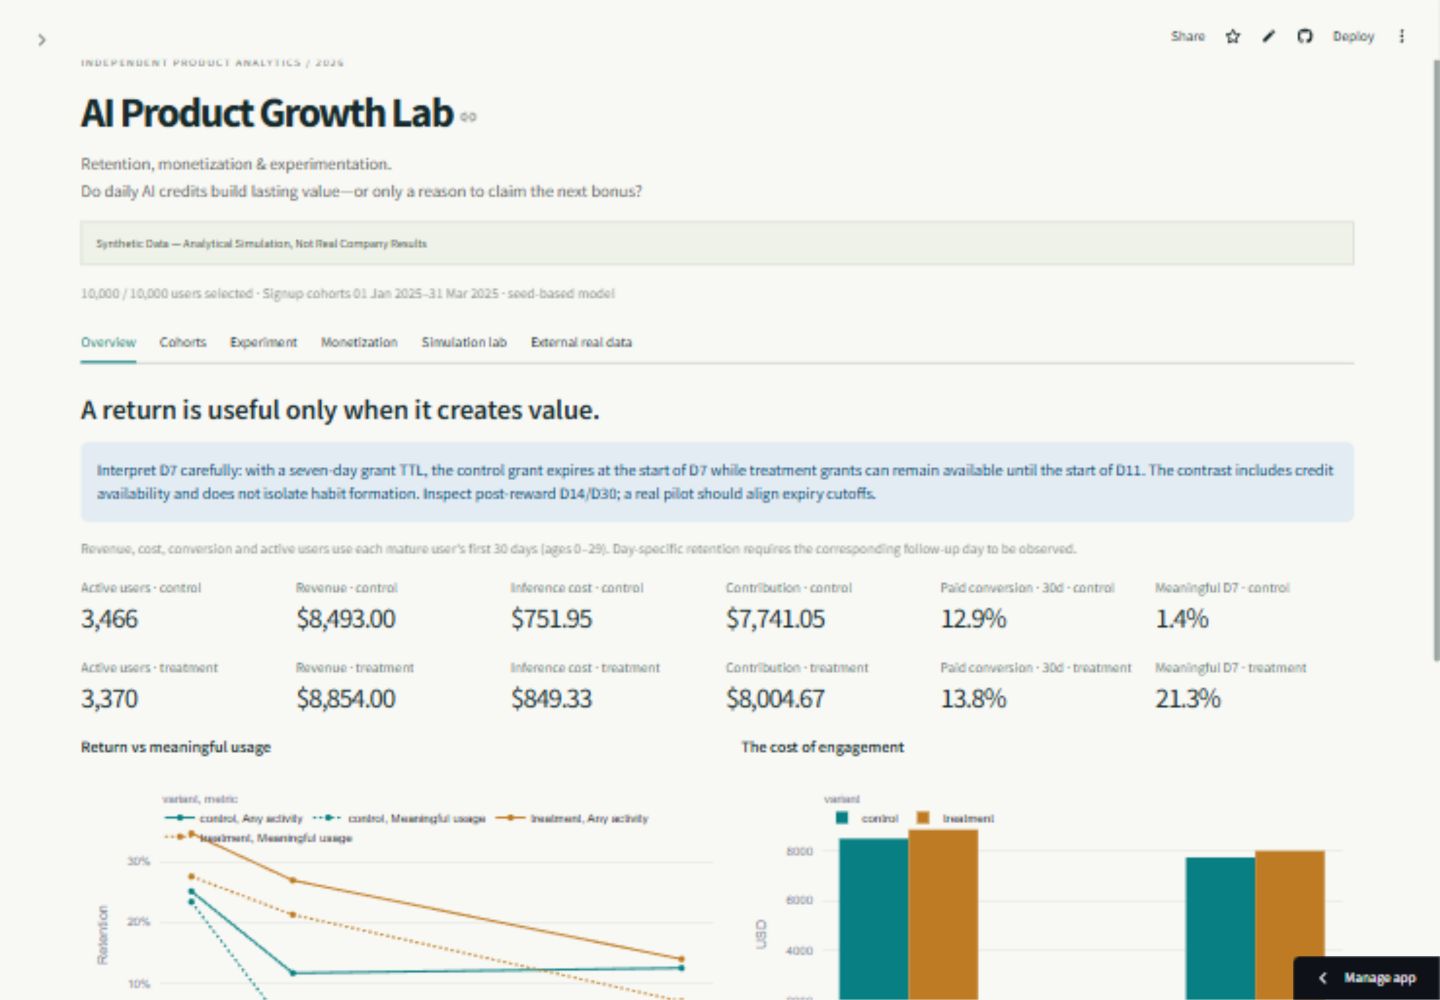
The Product Challenge
Free AI credits remove the first barrier. They do not necessarily create the next habit.
In her work on Monolit Network, Albina encountered a product question: new users received $5 in free tokens, many spent their balance in a single session, and some did not return afterward. A daily allocation was considered as an alternative.
No retained Monolit analytics or verified experiment results are available. Whether the proposed mechanic was implemented is unverified. This independent project uses that experience to formulate a research question and builds a new analytical simulation around it.
It is “which reward supports useful behavior at a sustainable cost?”
Behavioral Hypothesis
Distributing the same $5 entitlement across five eligible days may provide repeated opportunities to discover value. It may also attract visits that exist only to claim a bonus.
$5 upfront
One grant at signup.
The user chooses when to spend it.
$1 × five eligible days
Five bounded grants.
Entitlement is comparable at baseline.
Credits are issued on schedule while the user is eligible; issuance does not require a visit and does not guarantee one. Grant expiry, actual consumption and request-level inference costs are tracked separately.
Meaningful usage requires at least two successful AI requests on a day. It is a transparent, testable proxy—not evidence that a user's underlying task was completed. Bonus-only activity is tracked as a counter-metric.
Simulation Methodology
The model follows users forward in time. Acquisition channels select different segment distributions; random assignment is independent of those characteristics. Product value, prior usage, available balance, seasonality and scenario assumptions affect later behavior.
- 01Generate a heterogeneous population.
Model differences in intensity, willingness to pay and discovery of value. Keep inactive users in eligible denominators.
- 02Simulate connected behavior and ledgers.
Sessions produce requests, requests consume funded credits and incur inference cost; subscriptions generate explicit payments and can cancel.
- 03Observe a fixed calendar window.
Late signup cohorts have less follow-up. D30 requires day 30 to be observed; first-30-day economics use ages 0–29.
- 04Stress the assumptions.
A fixed seed reproduces each configuration. Positive, neutral and negative scenarios explore different mechanisms without guaranteeing a winner.
Data Architecture
One coherent data model supports SQL, Python, the dashboard and statistical analysis. The analytical unit remains the randomized user rather than a convenient sample of active sessions.
Validation checks primary-key uniqueness, referential integrity, observation windows, ledger balances and request-to-cost reconciliation. SQL uses CTEs, conditional aggregation and window functions where the metric requires them. Independent Python calculations provide parity checks.
Retention Analysis
Exact-day retention asks whether an eligible user returned on a specific age day. Cohort heatmaps expose maturation instead of treating censored cells as zero. Rolling retention answers a separate question: whether a user returned at or after a target day within the common observation window.
Run the reproducible pipeline to populate this section with calculated results. The dashboard reads the generated tables and exposes every denominator.
python -m scripts.pipelineCompare D1, D7 and D30 with meaningful retention, return frequency and successful requests. A rise in visits accompanied by bonus-only activity may indicate an incentive loop rather than growing product usefulness.
Experiment Design
A user-level, 50/50 randomized experiment compares a $5 upfront entitlement with $1 on each of five eligible days. The primary endpoint is meaningful D7 retention; the population includes all eligible assigned users.
| Primary endpoint | Meaningful D7 retention; treatment minus control |
|---|---|
| Practical threshold | At least +2 percentage points absolute lift |
| Inference | Two-sided α = 0.05; Newcombe score interval; user-level comparison |
| Integrity check | Sample ratio mismatch; investigate if p < 0.001 |
| Secondary endpoints | D1 / D7 / D30 and first-30-day paid conversion; Holm adjustment |
| Economic guardrails | Contribution per user no worse than −$0.25; conversion no worse than −1 pp, assessed using interval lower bounds |
| Behavior guardrail | Bonus-only activity increase no greater than +10 pp |
A sample-size calculation links the desired effect, baseline rate and 80% power. A/A checks evaluate test calibration; a behavioral A/A scenario checks whether treatment assignment alone changes generated behavior. Novelty is modeled explicitly and mature results deserve more weight than an early incentive spike.
Segment views are exploratory. Passing a synthetic decision rule supports prioritizing a real pilot; it does not justify a production launch.
Monetization & Unit Economics
A retail credit dollar is not an inference-cost dollar. Free entitlement, consumed balance, subscription receipts and modeled provider cost belong to different ledgers.
ARPU includes every mature assigned user; ARPPU includes only paying users. Financial comparisons use each mature user's first 30 days so early signup users do not receive a longer revenue opportunity. Contribution margin is undefined when revenue is zero.
The dashboard displays paid conversion, cost per user, credit consumption and profitability alongside retention. Acquisition, payroll, hosting, support, refunds and taxes are outside this contribution definition. It should not be presented as full profit or lifetime value.
Scenario Comparison
Rather than selecting one convenient set of assumptions, the lab makes the economic trade-off visible.
| Scenario | Behavioral assumption | Question to investigate |
|---|---|---|
| Positive | Repeated discovery supports useful behavior and purchase propensity. | Does meaningful retention improve while guardrails remain intact? |
| Neutral | Return incentives create some activity, with limited value learning. | Is the practical lift distinguishable from uncertainty? |
| Negative | Bonus seeking displaces meaningful usage and willingness to pay. | Can engagement increase while contribution deteriorates? |
The interactive lab varies credit size, grant frequency, expiry, inference cost, subscription price, return propensity and purchase propensity. A run compares with a neutral baseline using the same seed and population size. Assignment and channel draws are shared; latent behavior is re-simulated, so sensitivity differences are unpaired. Saved runs support deliberate comparisons; changing credit size changes total entitlement and must be interpreted accordingly.
Product Recommendations
Treat daily credits as a discovery mechanism. Validate the value created, not just the visits attracted.
- Instrument useful outcomes before scaling incentives. Track successful requests, task completion where possible, bonus claims, expiry and inference spend in separate events.
- Keep the default budget bounded. Compare equal total entitlements first. Test larger budgets only under an explicit economic hypothesis.
- Advance only with aligned evidence. Require a practical improvement in meaningful retention, assignment integrity and acceptable economic guardrails.
- Study high-cost and low-value segments. Use exploratory segments to design new hypotheses, then validate those hypotheses prospectively.
- Run a real pilot before making a company claim. Preregister outcomes, collect complete follow-up and examine persistence after the five-day reward ends.
Limitations & Learnings
The model encodes plausible mechanisms rather than learning them from Monolit records. It does not model competition, network effects, fraud, full lifetime value or verified task success. Short-run return rates may overstate enduring value. Model uncertainty cannot be repaired by increasing the simulated sample.
“Meaningful” activity is an operational proxy. A real product would need qualitative discovery and instrumented task outcomes to establish what users value.
12,330 e-commerce sessions.
A different question, a different domain.
The UCI Online Shoppers Purchasing Intention dataset is analyzed independently under CC BY 4.0. Session purchase rates and their uncertainty can be estimated; absent stable user IDs and event timestamps, user retention and causal effects cannot.
Missingness and repeated feature rows are inspected explicitly. Repeated rows are not automatically deleted because identical session features need not imply duplicate records. These results are never transferred to an AI SaaS conclusion.
Explore the independent real-data study ↗Inspect dataset provenance and license ↗
The central learning: credible analytics begins with the observation unit, eligible denominator and decision boundary—not with a persuasive chart.
My Contribution
This independent portfolio project connects a product question from Albina's Monolit experience with a reproducible analytical system: behavioral modeling, connected data design, SQL metrics, Python validation, experimentation, sensitivity analysis and a working interface.
It complements her Hotel Guest Experience Platform, which demonstrates UX research, business analysis, UML and MVP design. The growth lab centers on analytical reasoning, uncertainty and economic decisions.
The source and accompanying interview materials document what the simulation can establish and what would require real product evidence. Development used AI assistance; the project is designed for its author to reproduce, explain and critically assess.